Use gglgbtq to customize your plots with LGBTQ+ palettes and tailored themes. Pride aside, flag colors usually make good categorical palettes.
Author
Laura Bakala
Published
August 20, 2022
Note
This post originally appeared on the Turtletopia blog.
If you use the gglgbtq palettes, we’d love you to share your plots on twitter with #RainbowR.
It was always the plan for pridepalettes to become a package and here at RainbowR we are very grateful to our friends at Turtletopia for taking this on!
N.B. for LGBTQ+ inclusive datasets, check out TidyRainbow.
This will be a short post, since I’m busy playing blues this week. At least the topic’s short!
It all began with a post by RainbowR on Twitter:
As a very curious person, I had to check their GitHub account. And I found a repository curiously named pridepalettes. I was a little disappointed to find out it’s just a single script with little reusability. I hoped for a package!
A quick research showed me a few more repos with pride colors, but none I could download from CRAN. In fact, only one was a package at all!
So I took matters into my own hands and created gglgbtq.
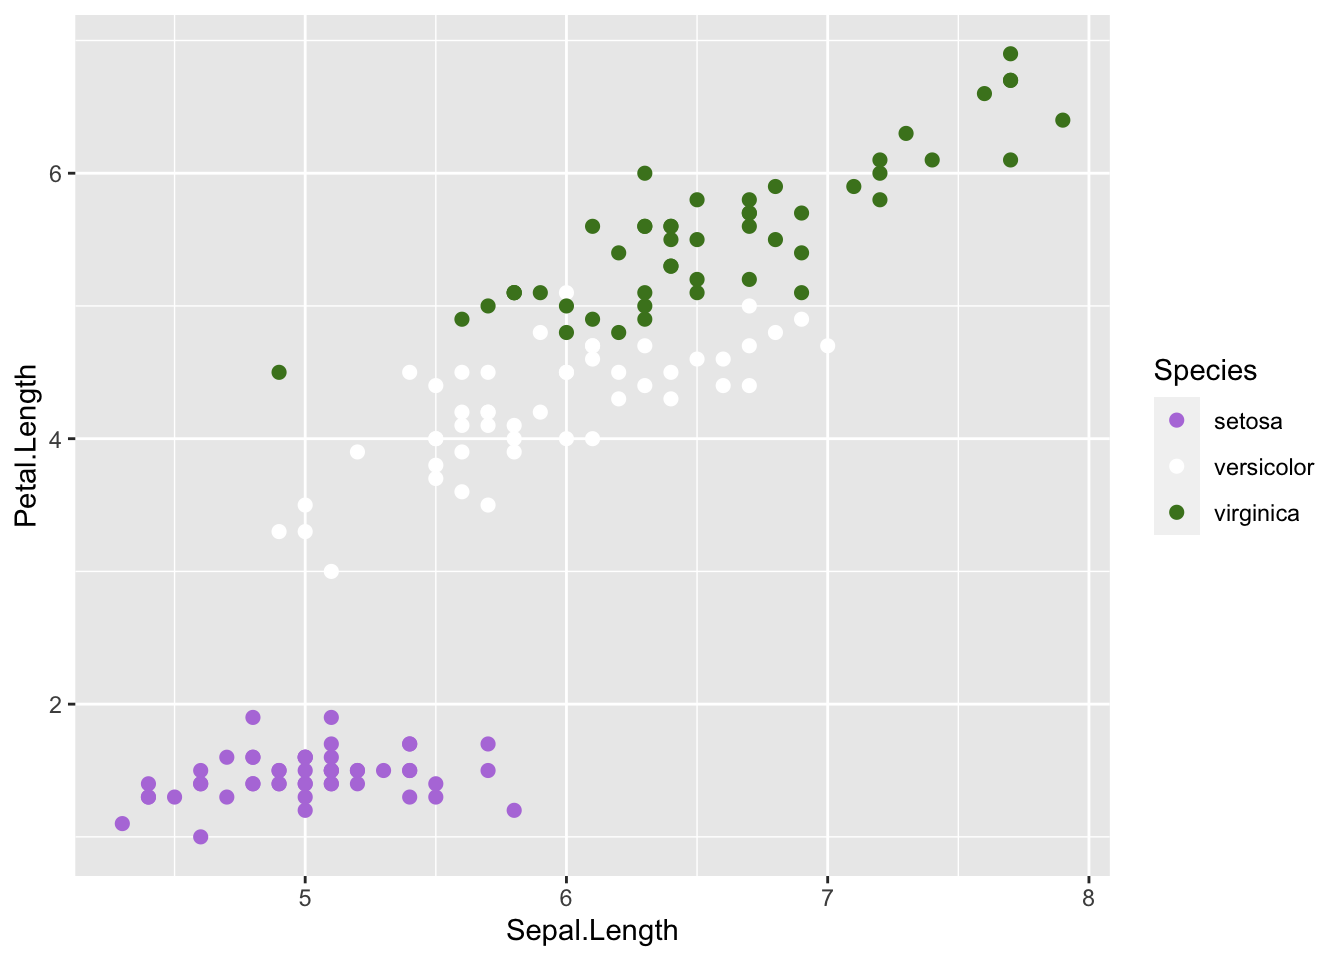
It would be easy to just scrape the colors of multiple flags, slap a palette_lgbtq() function on top of ’em, and call it a day. But it would be barely usable. Have you ever used white for a group with default ggplot2 settings? It’d be barely visible.
Toggle the code
# I swear it's the last time I'd use iris datasetlibrary(ggplot2)library(gglgbtq)ggplot(iris, aes(x = Sepal.Length, y = Petal.Length, color = Species)) +geom_point(size =2) +scale_color_manual(values =palette_lgbtq("genderqueer"))
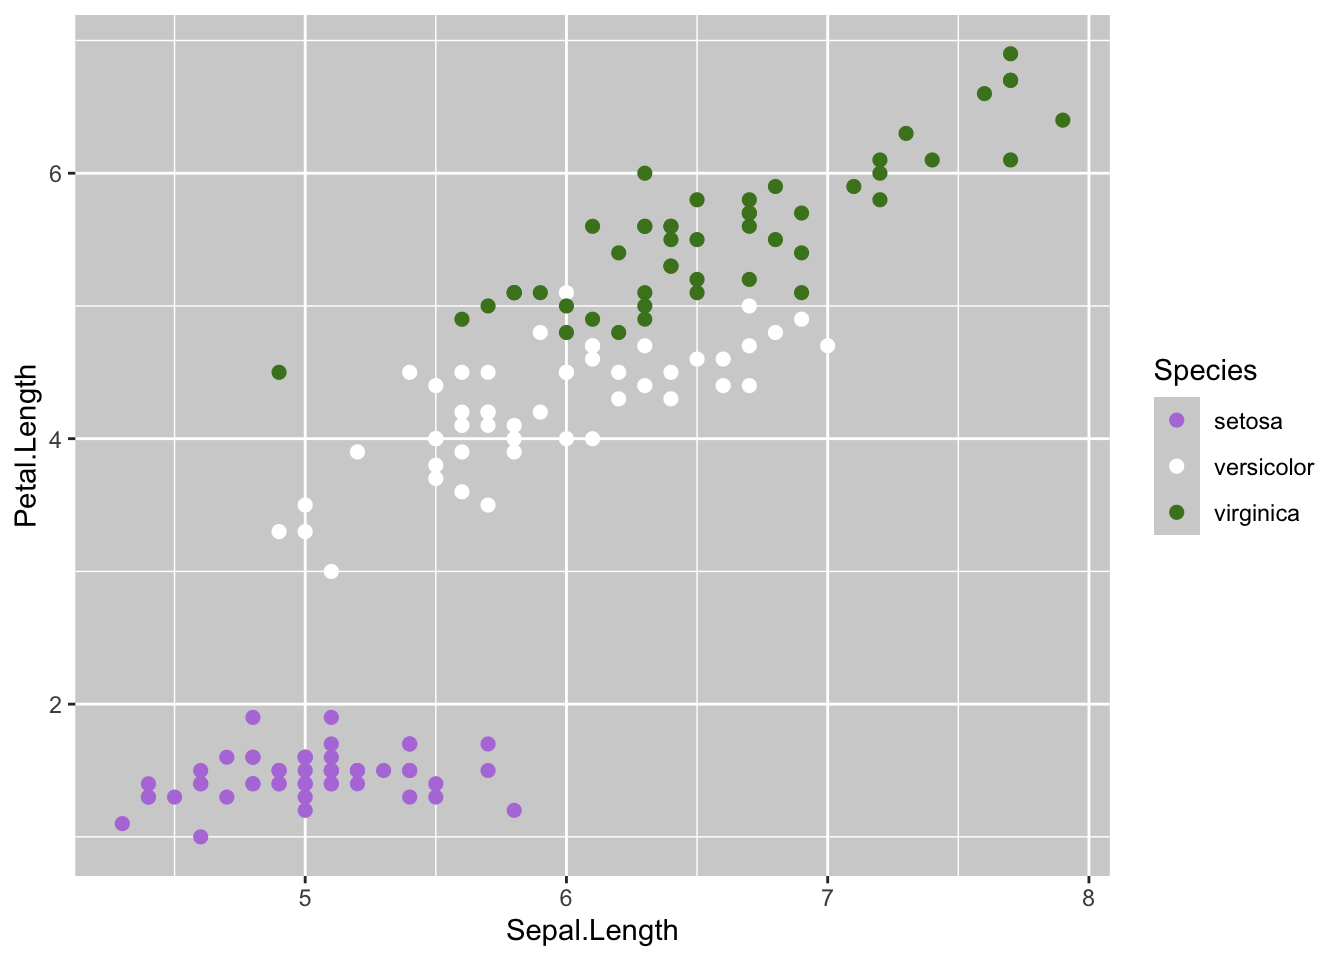
This is why I included theme_lgbtq(). Each palette has its own custom theme for increased readability (although many themes are reused across multiple palettes). Check out the difference!
Toggle the code
# Is it considered "another time" or just "the last use part II"?ggplot(iris, aes(x = Sepal.Length, y = Petal.Length, color = Species)) +geom_point(size =2) +scale_color_manual(values =palette_lgbtq("genderqueer")) +theme_lgbtq("genderqueer")
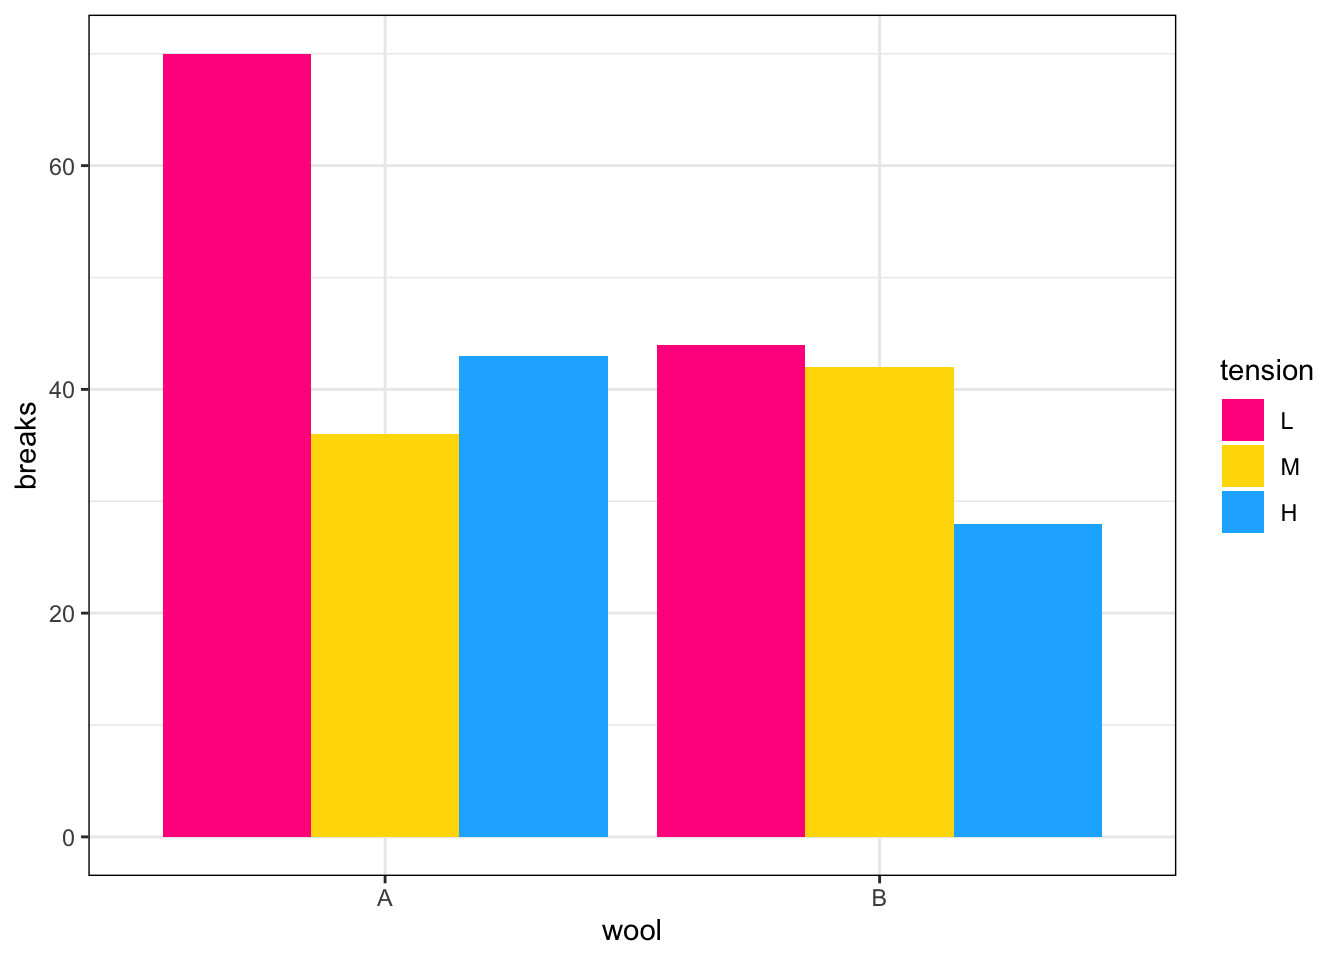
The difference isn’t much, but I found this gray to be the perfect balance for most palettes that include white (which is like 85% or so of all LGBT+ flags). But there are palettes without white, like this one:
Toggle the code
# I spent like 10 minutes sifting through the base datasets# but - behold! - a non-iris dataset at lastggplot(warpbreaks, aes(x = wool, y = breaks, fill = tension)) +geom_bar(stat ="identity", position ="dodge") +scale_fill_manual(values =palette_lgbtq("pansexual")) +theme_lgbtq("pansexual")
For now I included 16 palettes, but expect more (and if you want a specific flag to be included in the next release, write an issue on GitHub, strike a message on Twitter, or send a pigeon with a letter):
The Pride Palettes (edition gglgbtq 0.1.0)
Like what you see? You can get it from CRAN or GitHub, whichever suits you best:
Show us your pride plots on Twitter, we’d love to see them!
Source Code
---title: "Show pride on your plots"author: - Laura Bakaladate: "2022-08-20"description: | Use gglgbtq to customize your plots with LGBTQ+ palettes and tailored themes. Pride aside, flag colors usually make good categorical palettes.categories: ["R", "turtletools", "ggplot2", "pride", "LGBTQ+", "palettes"]image: palettes.pngtwitter-card: image: palettes.png card-style: "summary_large_image" creator: "@Rturtletopia" site: "@Rturtletopia"---:::{.callout-note}This post originally appeared on the [Turtletopia](https://turtletopia.github.io/2022/08/12/show-pride-on-your-plots/) blog.If you use the [gglgbtq](https://github.com/turtletopia/gglgbtq) palettes, we'd love you to share your plots on twitter with #RainbowR.It was always the plan for `pridepalettes` to become a package and here at RainbowR we are very grateful to our friends at Turtletopia for taking this on!N.B. for LGBTQ+ inclusive datasets, check out [TidyRainbow](https://github.com/r-lgbtq/tidyrainbow).:::This will be a short post, since I'm busy playing blues this week. At least the topic's short!It all began with a post by RainbowR on Twitter:{{< tweet R_LGBTQ 1555450735390871552 >}}As a very curious person, I had to check their GitHub account. And I found a repository curiously named [pridepalettes](https://github.com/r-lgbtq/pridepalettes). I was a little disappointed to find out it's just a single script with little reusability. I hoped for a package!A quick research showed me a few more repos with pride colors, but none I could download from CRAN. In fact, only one was a package at all!So I took matters into my own hands and created [gglgbtq](https://github.com/turtletopia/gglgbtq).It would be easy to just scrape the colors of multiple flags, slap a `palette_lgbtq()` function on top of 'em, and call it a day. But it would be barely usable. Have you ever used white for a group with default ggplot2 settings? It'd be barely visible.```{r genderqueer_no_theme}# I swear it's the last time I'd use iris datasetlibrary(ggplot2)library(gglgbtq)ggplot(iris, aes(x = Sepal.Length, y = Petal.Length, color = Species)) +geom_point(size =2) +scale_color_manual(values =palette_lgbtq("genderqueer"))```This is why I included `theme_lgbtq()`. Each palette has its own custom theme for increased readability (although many themes are reused across multiple palettes). Check out the difference!```{r genderqueer_w_theme}# Is it considered "another time" or just "the last use part II"?ggplot(iris, aes(x = Sepal.Length, y = Petal.Length, color = Species)) +geom_point(size =2) +scale_color_manual(values =palette_lgbtq("genderqueer")) +theme_lgbtq("genderqueer")```The difference isn't much, but I found this gray to be the perfect balance for most palettes that include white (which is like 85% or so of all LGBT+ flags). But there are palettes without white, like this one:```{r pansexual_w_theme}# I spent like 10 minutes sifting through the base datasets# but - behold! - a non-iris dataset at lastggplot(warpbreaks, aes(x = wool, y = breaks, fill = tension)) +geom_bar(stat ="identity", position ="dodge") +scale_fill_manual(values =palette_lgbtq("pansexual")) +theme_lgbtq("pansexual")```For now I included 16 palettes, but expect more (and if you want a specific flag to be included in the next release, write an issue on GitHub, strike a message on Twitter, or send a pigeon with a letter):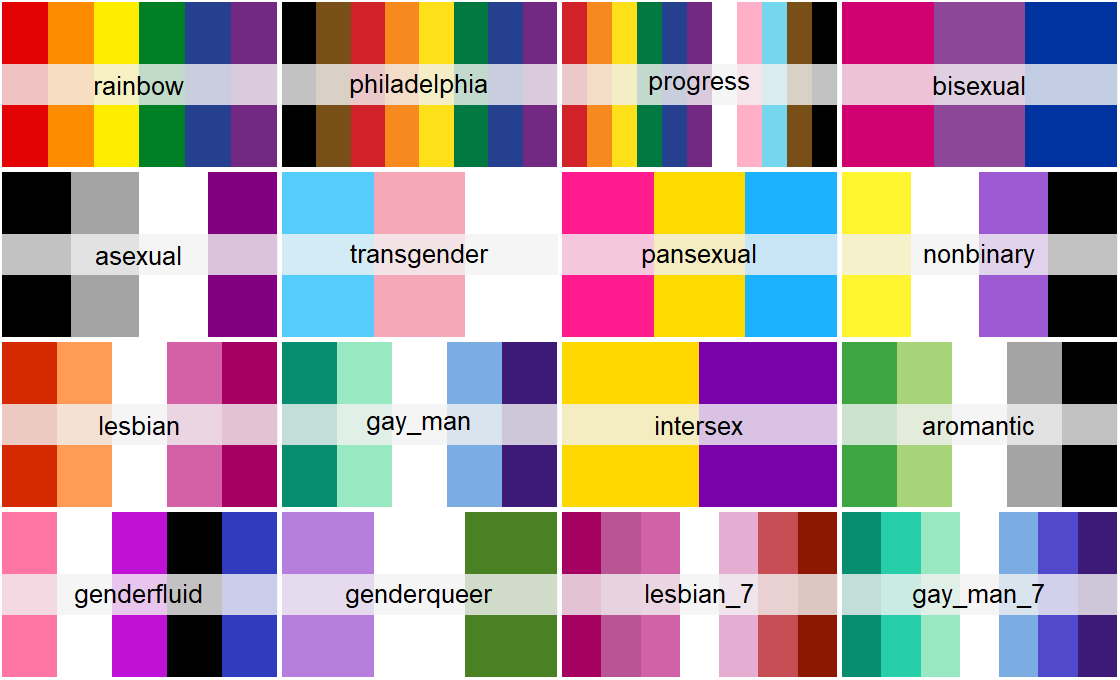Like what you see? You can get it from CRAN or [GitHub](https://github.com/turtletopia/gglgbtq), whichever suits you best:```{r install, eval=FALSE}install.packages("gglgbtq")remotes::install_github("turtletopia/gglgbtq")```Show us your pride plots on Twitter, we'd love to see them!